B-cube
Display complex data 3D dimensionally
Physical prototyping
Time: 2 weeks | January 2016
Type: Makeathon challenge | Personal
Skills: Product design | Interaction design | Rapid prototyping | Arduino
Team: Christopher Gi | Ettienne Bourbon | Lukas Flynn | Mindy Lee
Outcome: Physical prototype
PROJECT OVERVIEW
I was able to participate in a Makeathon event sponsored by Sliperiet Umeå and Cinnober during the winter of 2016. The purpose of the project was to create a tool that would allow a finance company get an overview of a complex system. We should design a physical representation of this system and consider how this could transform an organization, by making flows which may span across multiple teams or working groups understandable and coherent.
SOLUTION
B-Cube can easily and efficiently illustrate data trends to an employee. This data can range anywhere from a technician, Cinnober employee, or company CEO. Rather than focus on one form of data set, we chose to create a way for displaying the data in a way that was easily digestible.
HOW B-CUBE WORKS
In order to use the B-Cube the user simply connects it to the laptop, desktop, or server that they are using to process the data and input the data that they would like to take a closer look at. If they do observe a peak or valley the user can remove that bar and focus in on the data specific to that bar. By having a tool like this at employees disposal the company is able to spot costly errors early and predict future trends both of which increase their efficiency.
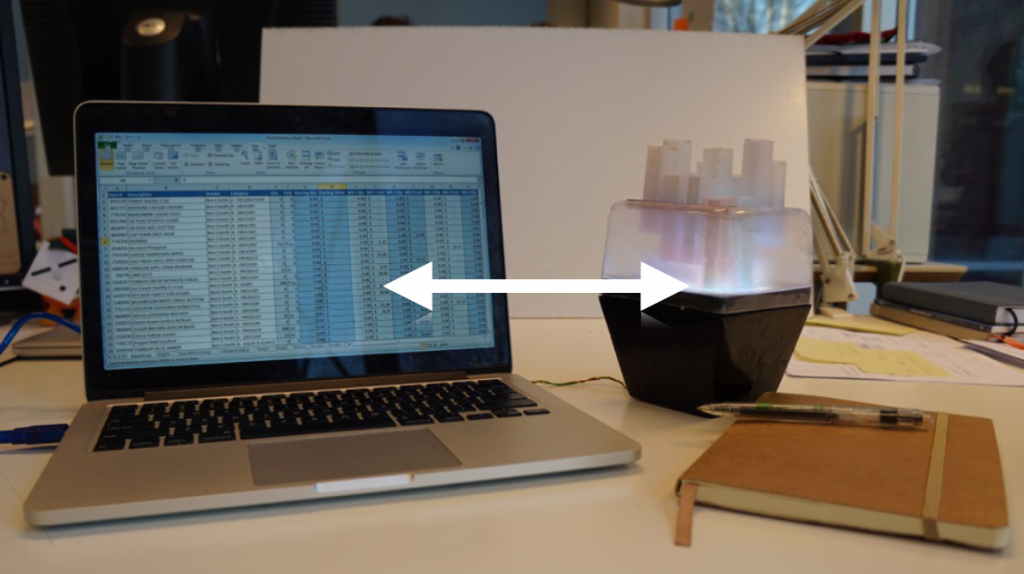
You can select and customize the data you are interested in seeing visualized
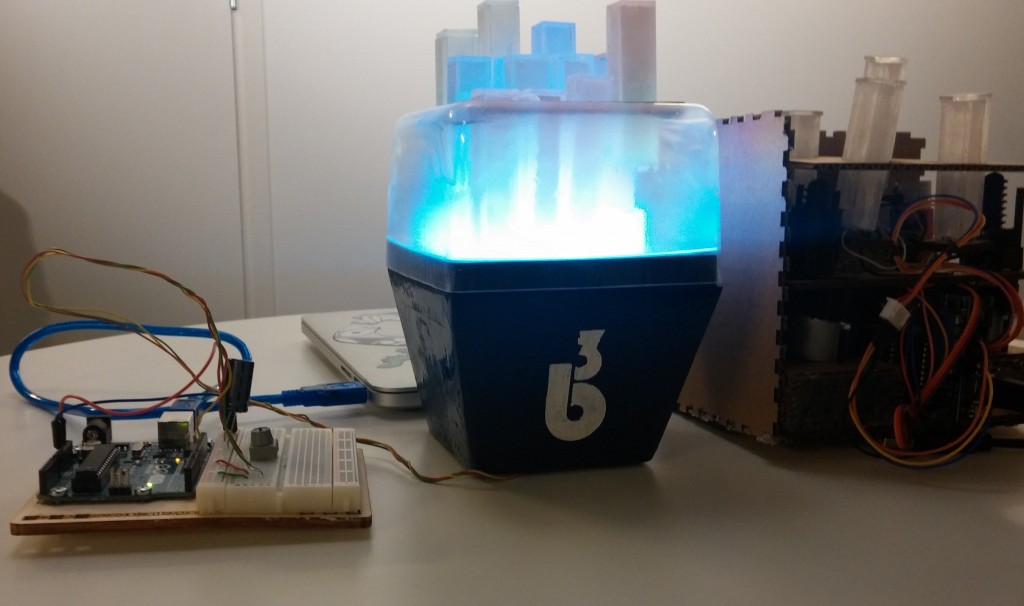
Each cube is outfitted with multi-colored LEDs, allowing you to stretch your data out to a fourth dimension.
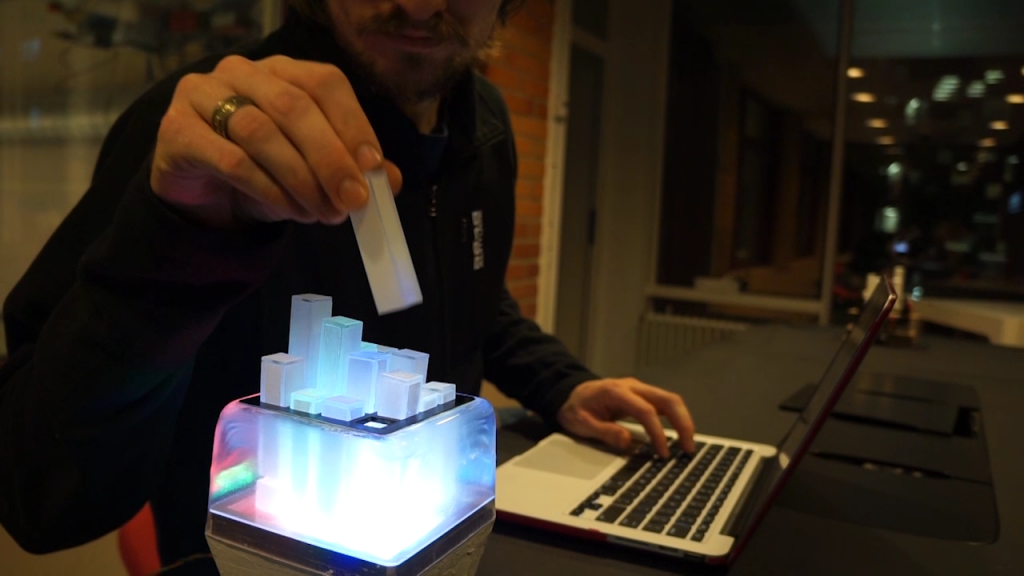
You can pick the cube you want and more details about that data point will appear on your desktop.
DESIGN PROCESS
My team analyzed the ways in which data interacts with employees at various levels in the financial sector. We spoke with technicians from Cinnober so as to understand the existing problems of the system. What we learned was that often times it is not necessary for the employee to be aware of every last detail. Rather, what was often times the most important takeaway from the data is spotting the peaks valleys in a data set. These areas are important because they often represent anomalous behavior or areas of business opportunity. The design process included brainstorming sessions (sketching, ideas) and a lot of discussions in order to find a solution for the problem. By designing a three-dimensional bar graph we are able to quickly provide this information to the user.
PROTOTYPING AND TESTING
We started with lo-fi prototyping using a laser cut cardboard box. We tested out a mechanism to make things go up and down with glowsticks and we programmed a series of neopixels to adjust in color. We used Arduino Uno, motor shield, step motors, continuous servos and two 3-D printed linear actuators.
CONCEPT VIDEO
B-cube
Making data work for you
Take a look!
Time: 2 weeks | January 2016
Type: Makeathon challenge | Personal
Skills: Product design | Interaction design | Rapid prototyping | Arduino
Team: Christopher Gi | Ettienne Bourbon | Lukas Flynn | Mindy Lee
Outcome: Physical prototype
Partners: Cinnober Innovation Labs, Uminova Expression, Sliperiet
![]()
![]()